Netflix Data Warehouse
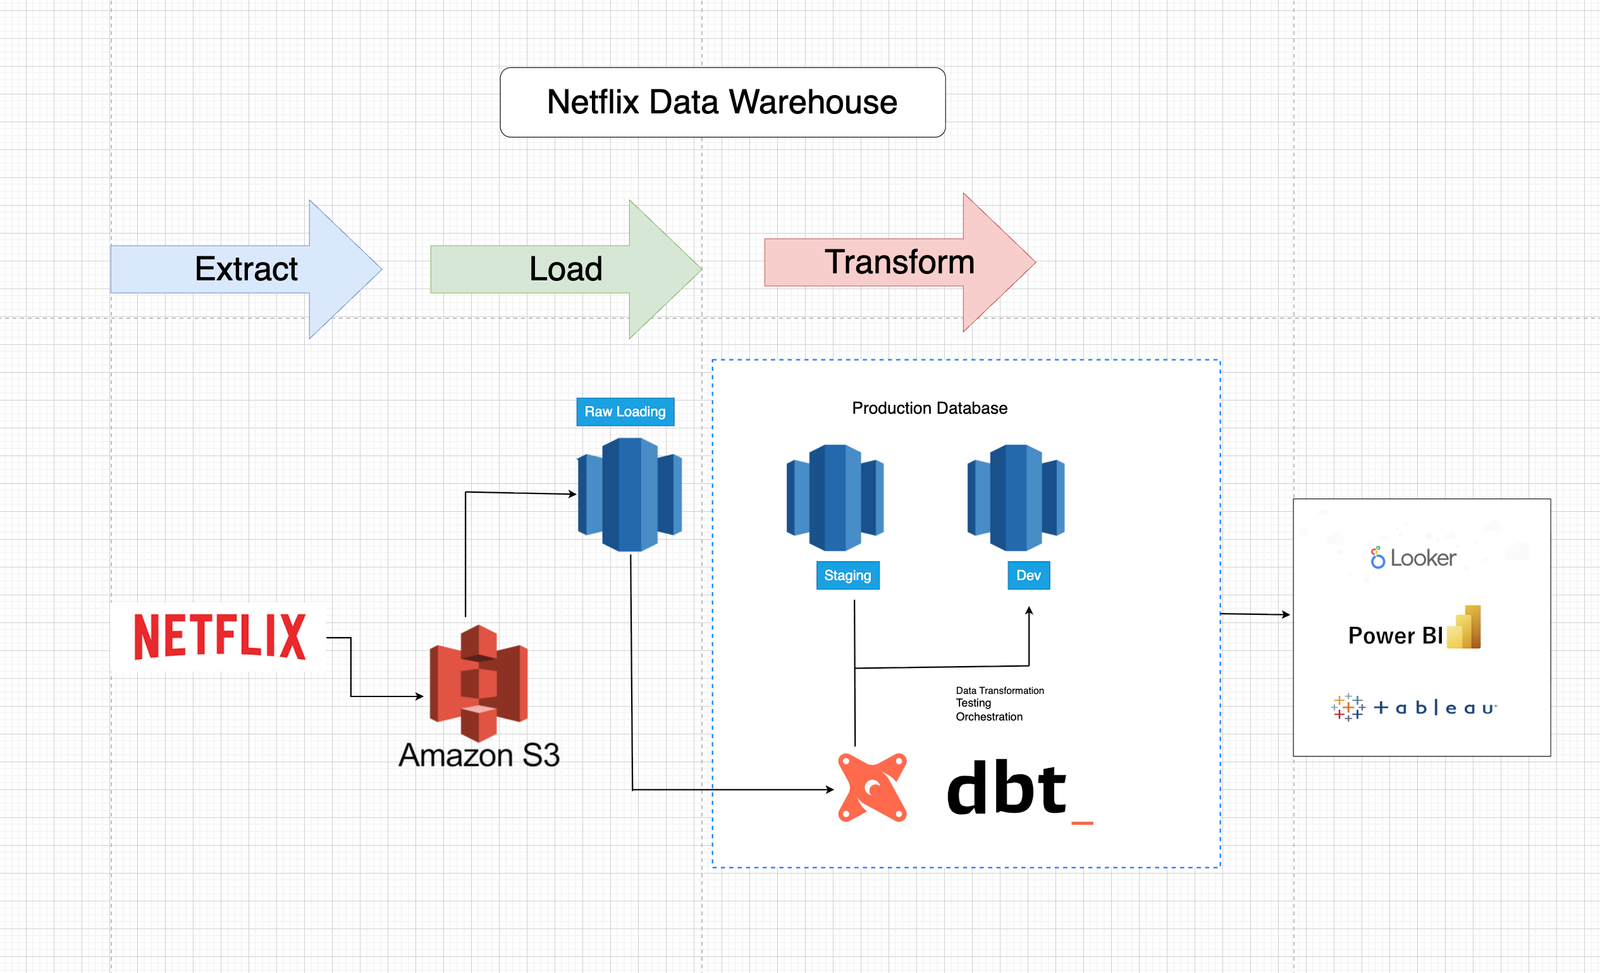
Built a scalable data pipeline on Amazon Redshift using dbt to transform and analyze Netflix datasets — staging, dimension, and fact tables, SCD Type 2 snapshots for historical change tracking, and custom data quality tests.
Data Engineer specializing in AWS-based data warehousing, ELT pipelines, and data modeling using Redshift, S3, dbt, SQL & Python.
Flagship data engineering work on the modern data stack
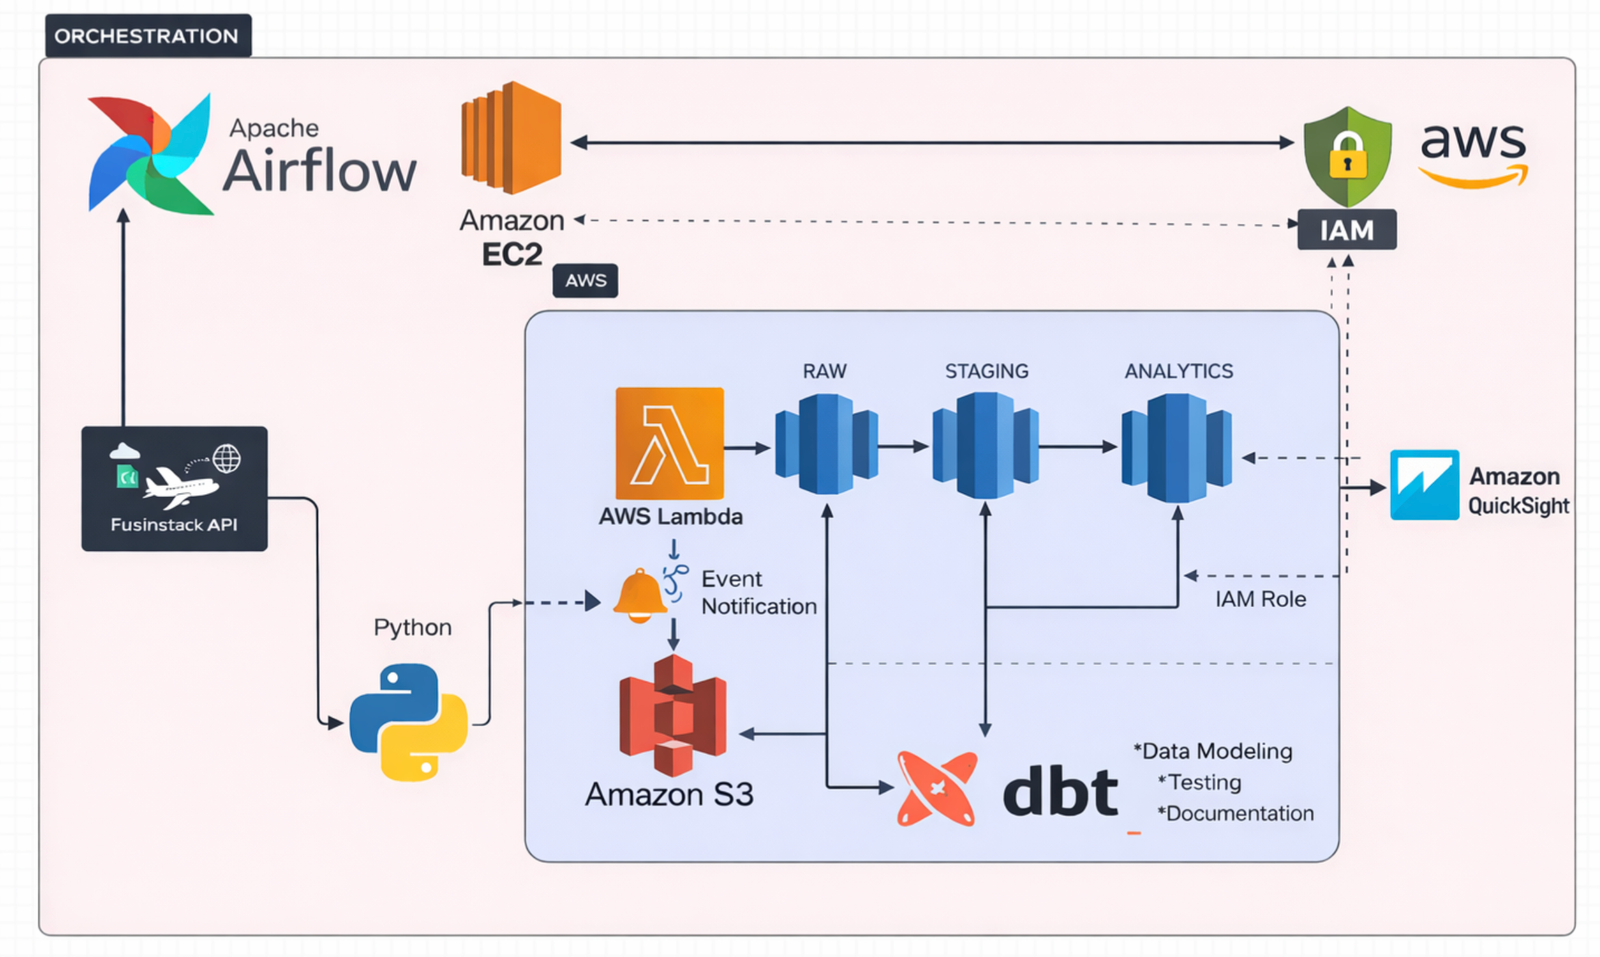
An end-to-end ELT pipeline that ingests live flight & reference data from the AviationStack API daily,
lands raw files in AWS S3, auto-loads them into Redshift Serverless via an S3-triggered Lambda function,
and transforms everything with dbt into a star schema — 7 dimension tables and a fact_flights
table tracking delays, on-time performance, and cancellations. Orchestrated end-to-end with Apache Airflow
and backed by 102 automated dbt data-quality tests.
Data engineering, analysis, and visualization across multiple domains
Built a scalable data pipeline on Amazon Redshift using dbt to transform and analyze Netflix datasets — staging, dimension, and fact tables, SCD Type 2 snapshots for historical change tracking, and custom data quality tests.
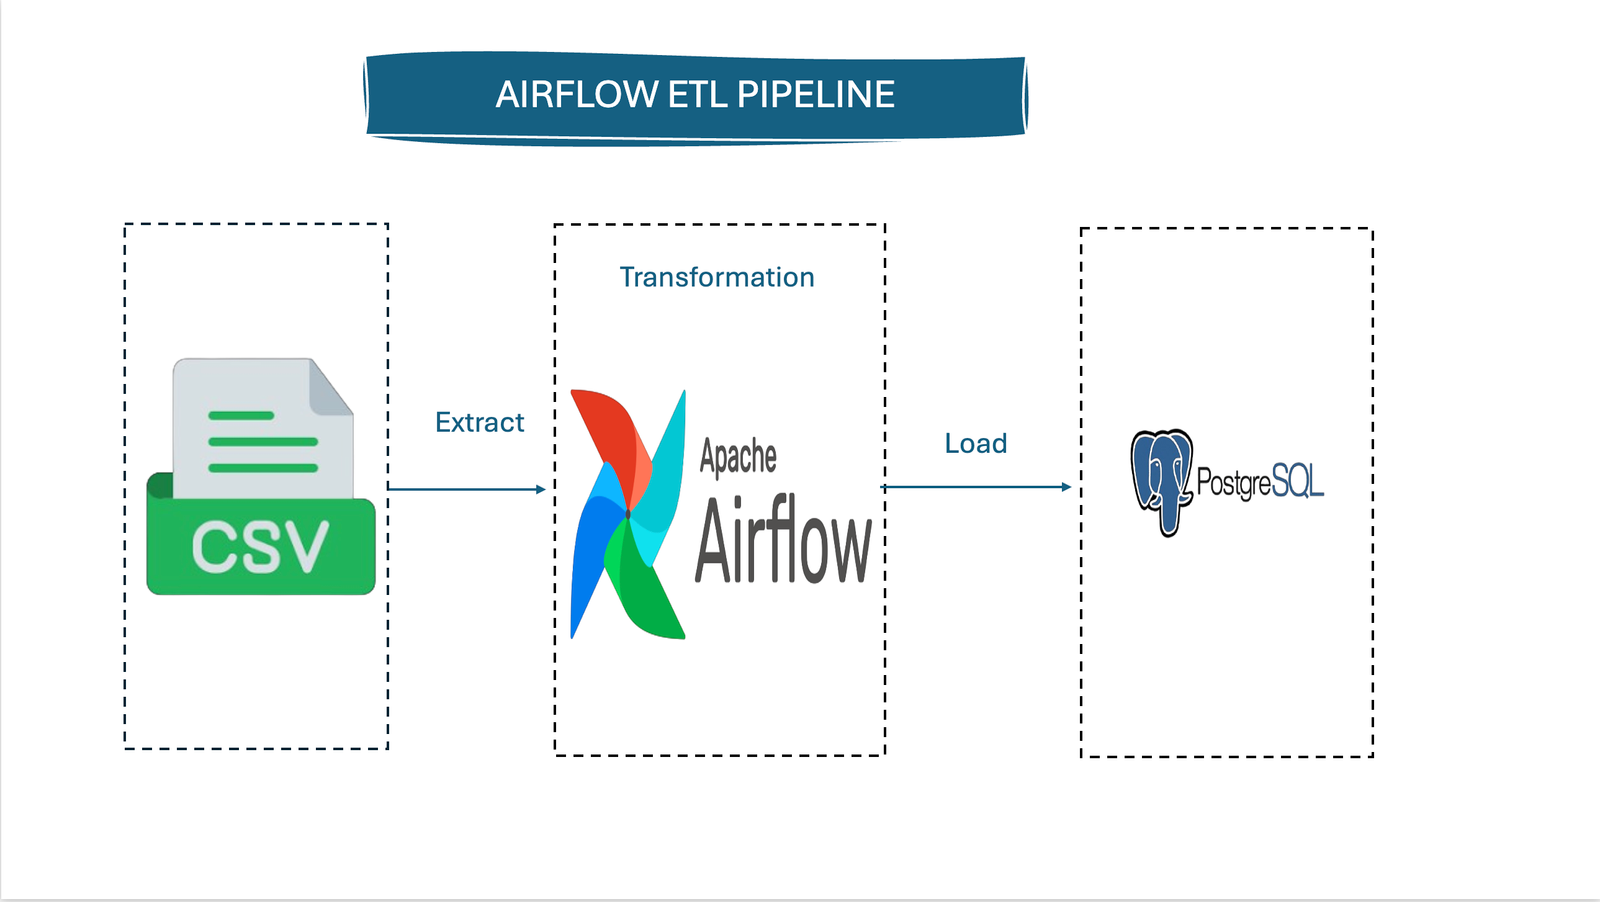
An ETL pipeline using Apache Airflow to extract customer data from CSV, clean it with pandas, and load it into PostgreSQL. Includes automated email alerts for pipeline success and failure.
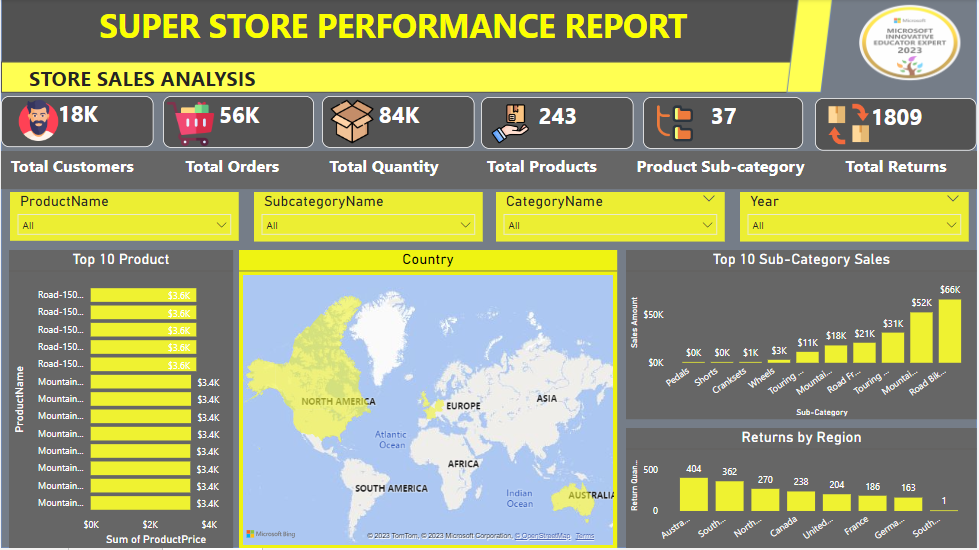
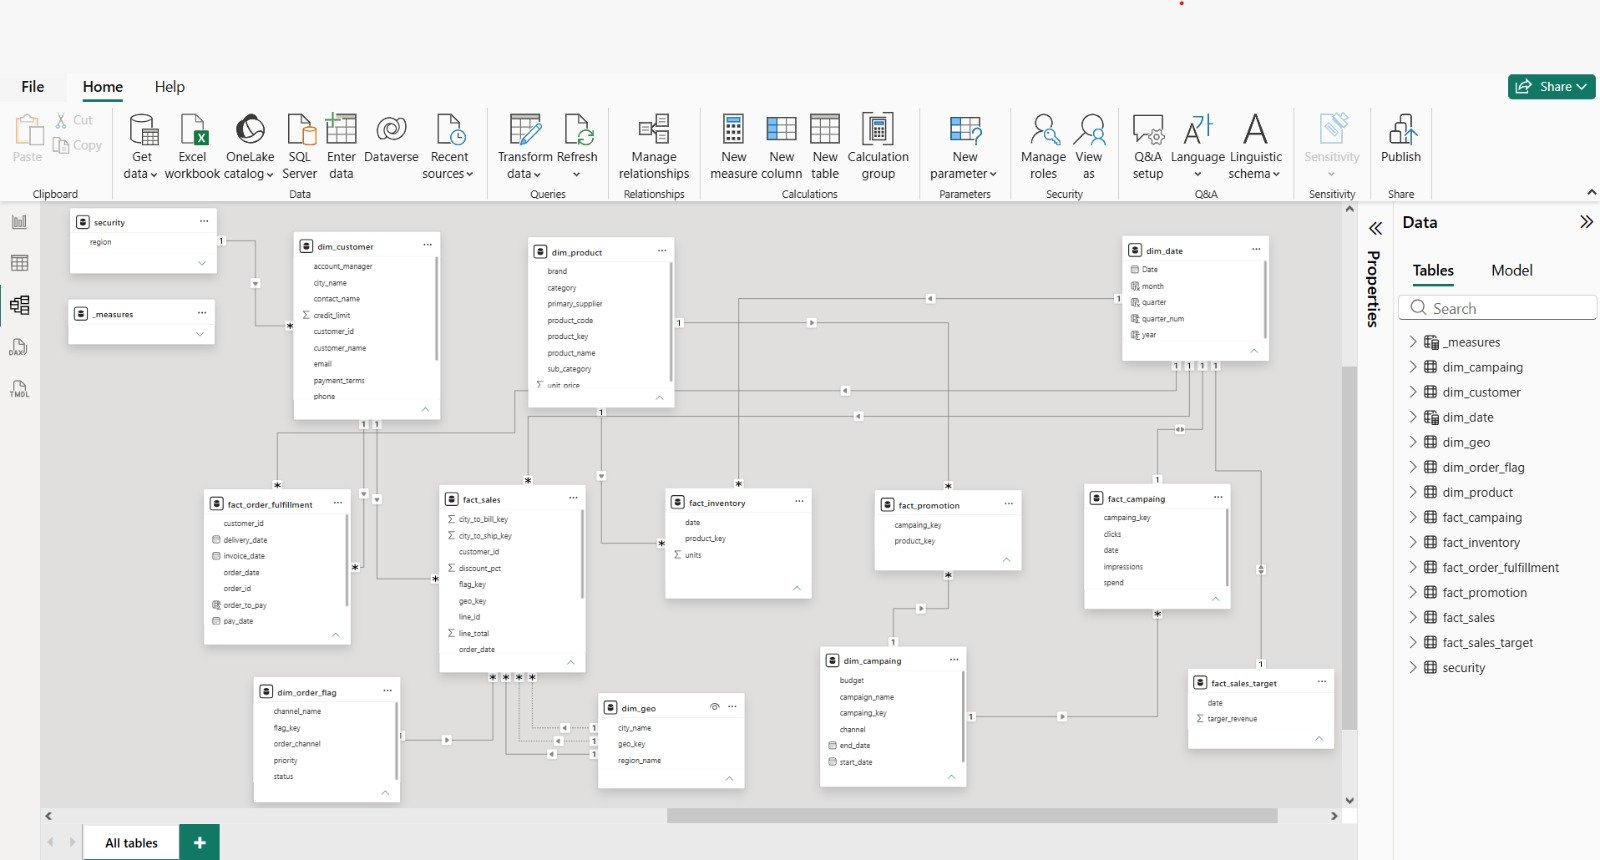
Advanced data analysis of a Superstore dataset in Power BI. Built an interactive dashboard with DAX measures showing total customers, orders, products sold, returns, and top-performing regions.
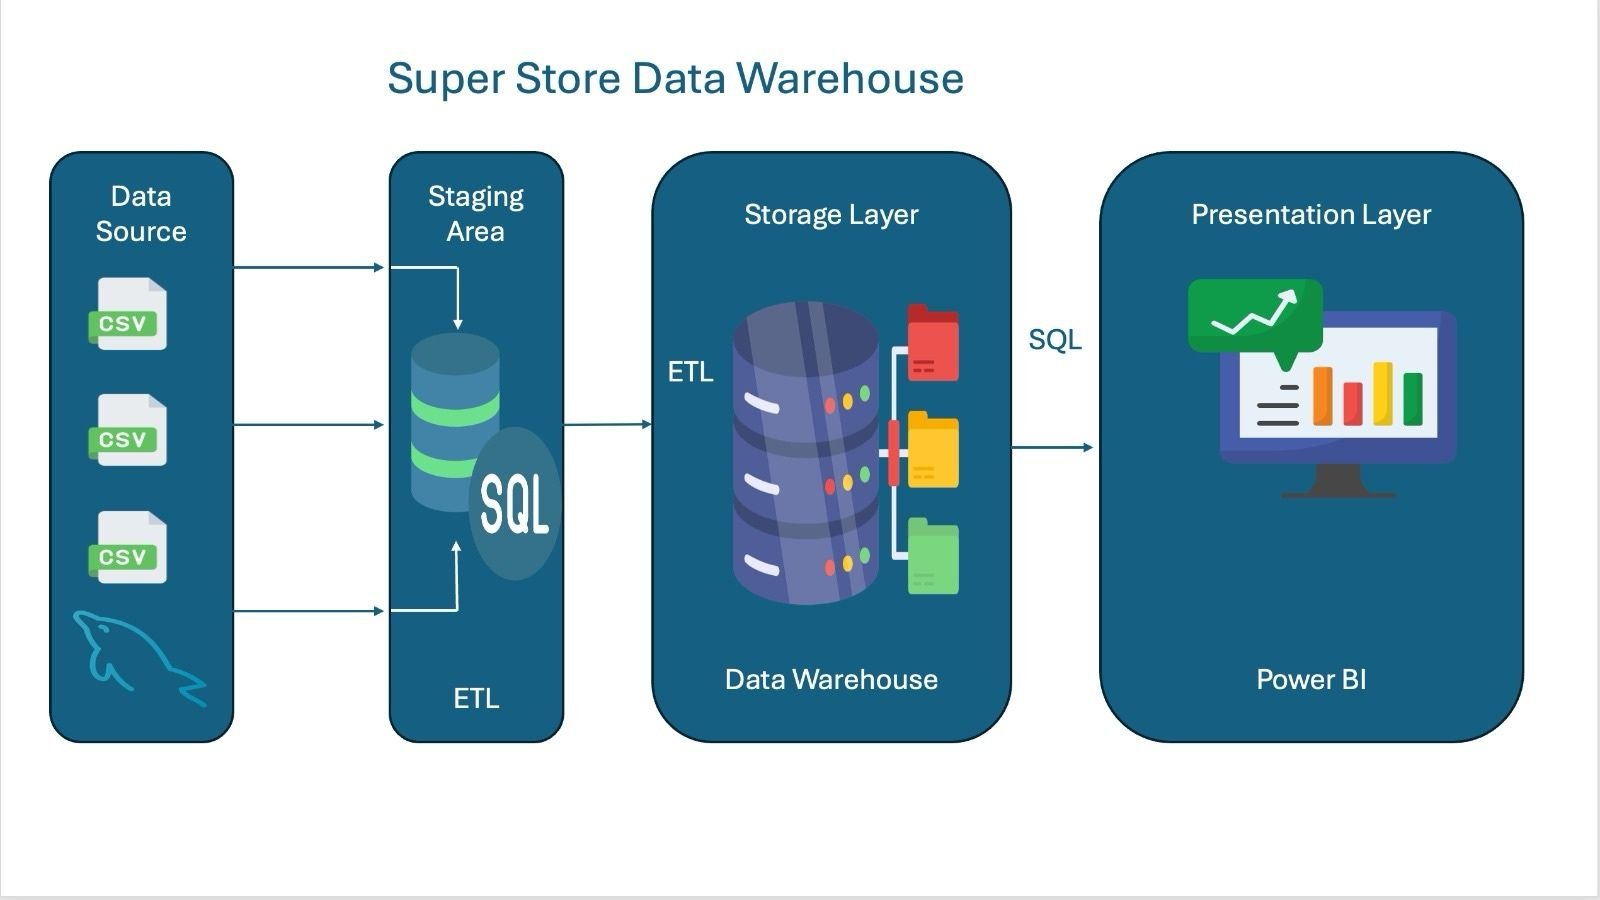
A data warehouse for analyzing sales, revenue, profit, and orders across regions. Built with MySQL and Pentaho using a star schema for efficient reporting and dashboards.
Advanced analysis of an e-commerce dataset using Python. Cleaned data by handling nulls, fixing data types, and removing outliers. Revealed top products, best sales months, and revenue by country.
EDA of an Apple App Store dataset in SQLite. Investigated whether paid apps rate higher, multilingual support effects on ratings, highest-priced categories, and description length vs. user ratings.
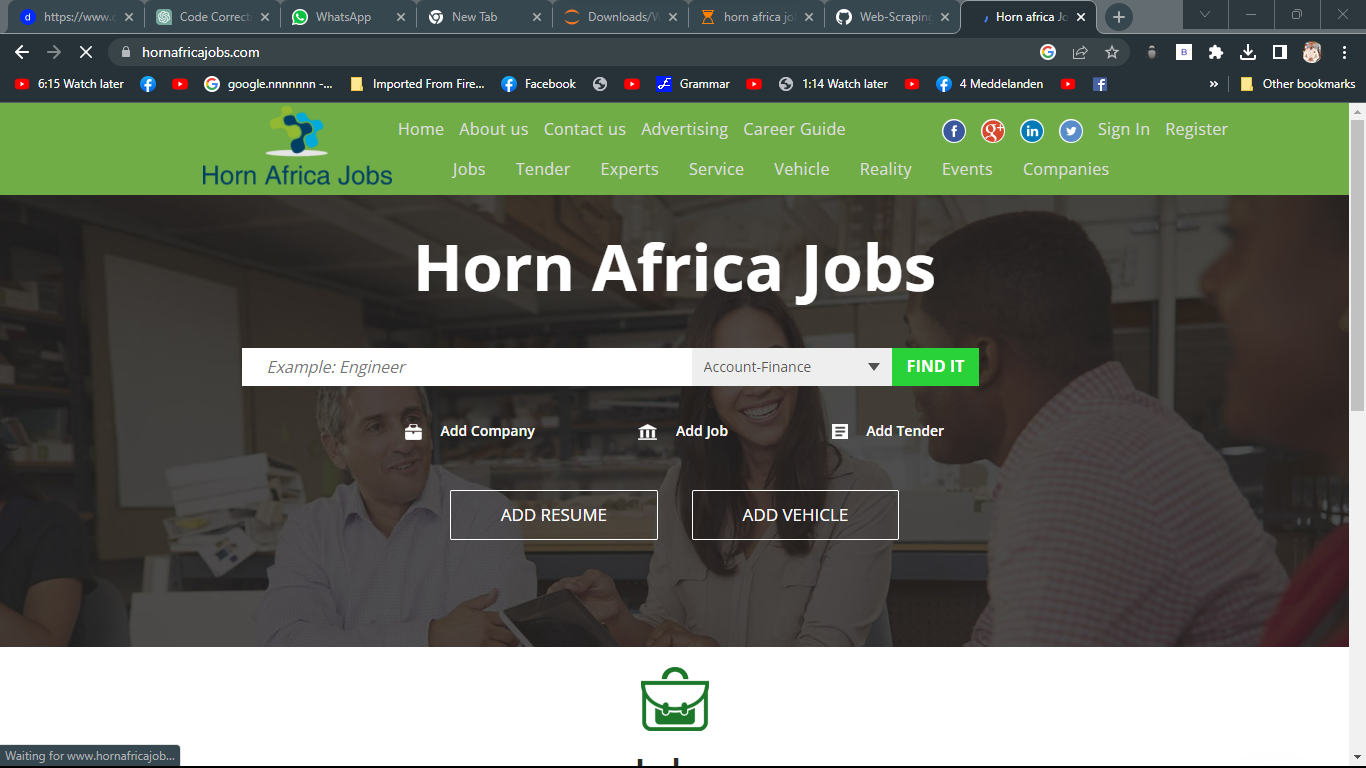
Scraped the Horn Africa Jobs website to extract job listings including job name, salary, and location. Data exported to CSV for trend analysis and job market research.
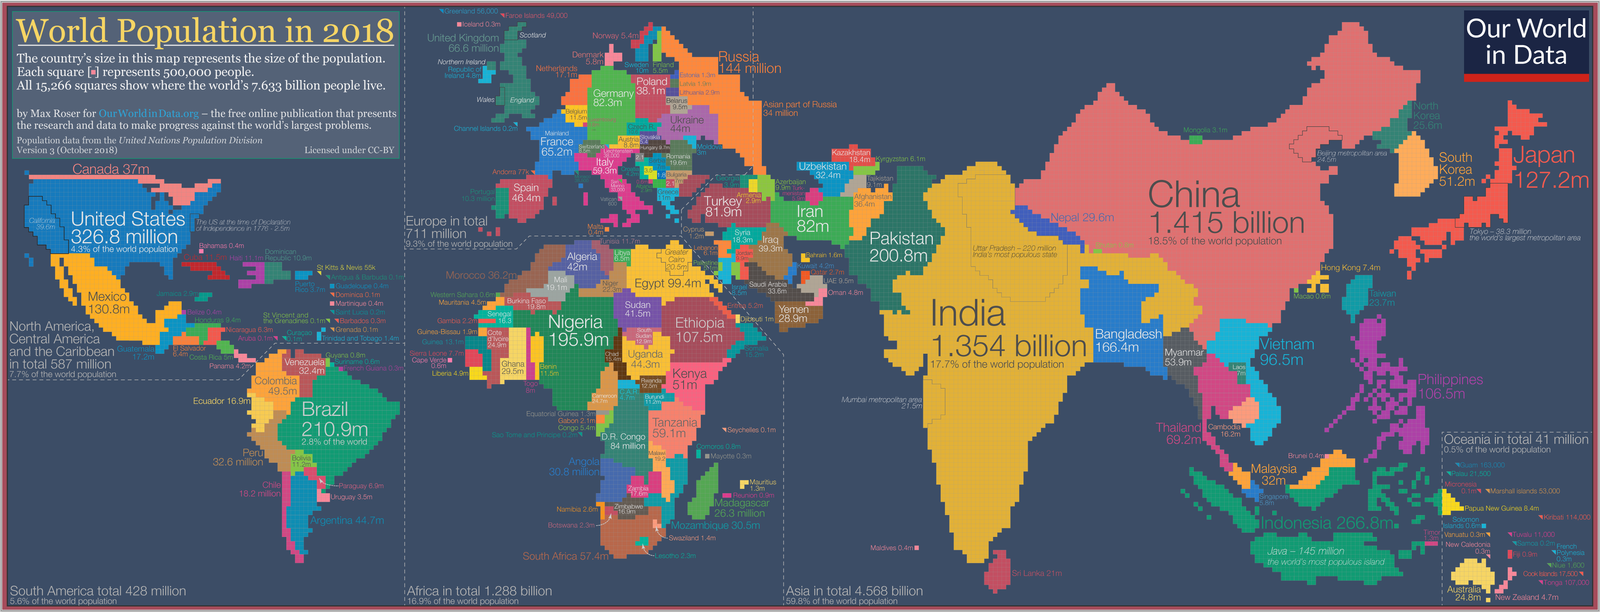
End-to-end project: scraped population data with BeautifulSoup, transformed it with Python, and visualized top countries by population, median age, and land area in Power BI. Results delivered via automated email.
Analyzed IBM's employee dataset to uncover retention insights. Cleaned data, categorized working years, and built an interactive pivot dashboard revealing turnover by department, role, and education level.